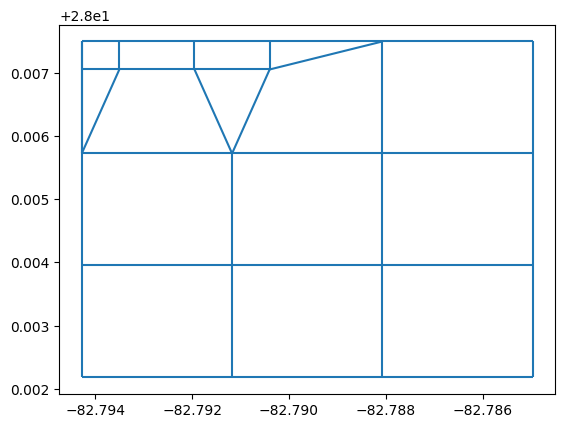
基于水深的二维网格 Casulli 加密
接口版本差异
原示例代码使用旧名称 mkernel_set_property 和 mkernel_mesh2d_casulli_refinement_based_on_depths。当前 8.3.0 源码中的对应接口为 mesh2d_set_property 和 mesh2d_casulli_refinement_based_on_depths;实际运行时请依据 完整 API 参考 调整。以下保留原示例代码。
以下保留原笔记本的代码和已保存输出;转换过程中未重新执行代码。
import matplotlib.pyplot as plt
from pathlib import Path

plt.close("all")
import xarray as xr
import numpy as np
import meshkernel
from meshkernel import (
    MakeGridParameters,
    MeshKernel,
    GeometryList,
    GriddedSamples,
    ProjectionType,
    MeshRefinementParameters,
    RefinementType,
    InterpolationType,
    InterpolationParameters,
)

mk_version = meshkernel.__version__
示例 1:加密笛卡尔坐标网格
mk = MeshKernel(ProjectionType.CARTESIAN)

x_start, x_end = 0, 10000
y_min, y_max = 0, 10000
num_samples = 100

makeGridParameters = MakeGridParameters()
makeGridParameters.origin_x = x_start
makeGridParameters.origin_y = y_min
makeGridParameters.upper_right_x = x_end
makeGridParameters.upper_right_y = y_max
makeGridParameters.block_size_x = 1000
makeGridParameters.block_size_y = 1000

mk.mesh2d_make_rectangular_mesh_on_extension(makeGridParameters)
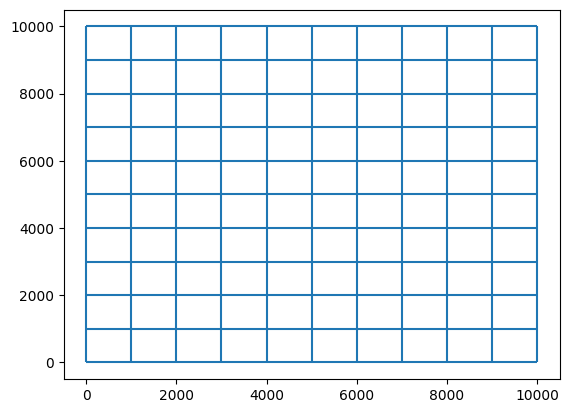
绘制初始笛卡尔坐标网格
mesh2d_not_refined = mk.mesh2d_get()
fig, ax = plt.subplots()
mesh2d_not_refined.plot_edges(ax)
x_grid, y_grid = np.meshgrid(
    np.linspace(x_start, x_end, num_samples), np.linspace(y_min, y_max, num_samples)
)
values = np.array(np.interp(x_grid, [x_start, x_end], [-10.0, 5.0]), dtype=np.double)
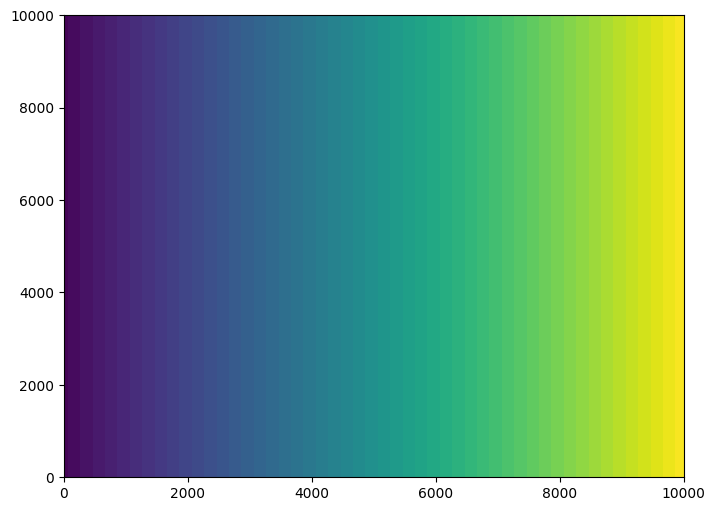
绘制采样数据集
plt.figure(figsize=(8, 6))
plt.contourf(x_grid, y_grid, values, levels=50)
<matplotlib.contour.QuadContourSet at 0x1f054cec790>
samples = GeometryList(
    x_coordinates=np.array(x_grid.flatten(), dtype=np.double),
    y_coordinates=np.array(y_grid.flatten(), dtype=np.double),
    values=np.array(values.flatten(), dtype=np.double),
)
interpolation_parameters = InterpolationParameters()
interpolation_parameters.interpolation_type = InterpolationType.AVERAGING

property_id = mk.mkernel_set_property(interpolation_parameters, samples)

x_coordinates_pol = np.empty(0, dtype=np.double)
y_coordinates_pol = np.empty(0, dtype=np.double)
polygons = GeometryList(
    x_coordinates=x_coordinates_pol, y_coordinates=y_coordinates_pol
)

meshRefinementParameters = MeshRefinementParameters()
minimumRefinementDepth = 0.0
mk.mkernel_mesh2d_casulli_refinement_based_on_depths(
    polygons, property_id, meshRefinementParameters, minimumRefinementDepth
)
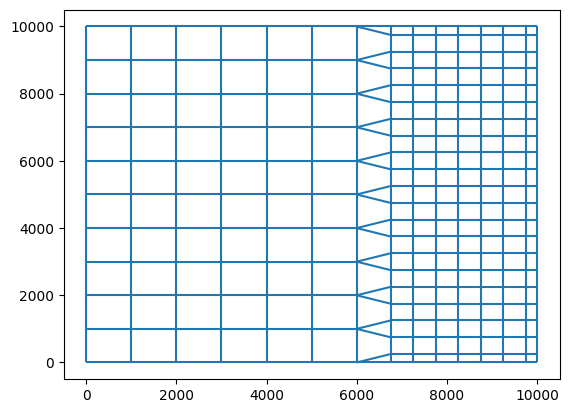
绘制加密后的网格(应能看到变化)
mesh2d_refined = mk.mesh2d_get()
fig, ax = plt.subplots()
mesh2d_refined.plot_edges(ax)
示例 2:使用较小区域的真实水深数据进一步细化分析
读取采样数据的辅助函数
def read_and_filter_samples(file_path, lower_left, upper_right):
    """
    读取包含采样数据(纬度、经度、水深)的文本文件,筛选边界框内的采样点,
    返回三个双精度 NumPy 数组(纬度、经度、水深)。

    :param file_path: 包含数据的文本文件路径。
    :param lower_left: 边界框左下角的(纬度、经度)元组。
    :param upper_right: 边界框右上角的(纬度、经度)元组。
    :return: 包含纬度、经度、水深三个 NumPy 数组的元组。
    """
    latitudes = []
    longitudes = []
    depths = []

    # 解包边界框角点坐标
    ll_lat, ll_long = lower_left
    ur_lat, ur_long = upper_right

    try:
        with open(file_path, "r") as file:
            for line in file:
                # 将该行解析为纬度、经度和水深
                parts = line.strip().split("\t")
                if len(parts) != 3:
                    continue

                try:
                    lat, long, depth = map(float, parts)
                except ValueError:
                    continue

                # 检查采样点是否位于边界框内
                if ll_lat <= lat <= ur_lat and ll_long <= long <= ur_long:
                    latitudes.append(lat)
                    longitudes.append(long)
                    depths.append(depth)

    except FileNotFoundError:
        print(f"Error: File {file_path} not found.")
        return (
            np.array([], dtype=np.double),
            np.array([], dtype=np.double),
            np.array([], dtype=np.double),
        )
    except Exception as e:
        print(f"An error occurred: {e}")
        return (
            np.array([], dtype=np.double),
            np.array([], dtype=np.double),
            np.array([], dtype=np.double),
        )

    # 将列表转换为 double 类型的 NumPy 数组
    return (
        np.array(latitudes, dtype=np.double),
        np.array(longitudes, dtype=np.double),
        np.array(depths, dtype=np.double),
    )
input_file = "stpete.xyz"
input_file_path = Path().absolute() / "data_examples" / input_file

lower_left_corner = (-82.79428, 28.00218)
upper_right_corner = (-82.76323, 28.02404)
# 读取并筛选采样数据
x_coordinates, y_coordinates, values = read_and_filter_samples(
    input_file_path, lower_left_corner, upper_right_corner
)
生成规则网格
lon_min, lon_max, lat_min, lat_max = -82.79428, -82.76323, 28.00218, 28.02404
dx = (lon_max - lon_min) / 10.0
dy = (lat_max - lat_min) / 10.0

makeGridParameters = MakeGridParameters(
    angle=0,
    origin_x=lon_min,
    origin_y=lat_min,
    upper_right_x=lon_max,
    upper_right_y=lat_max,
    block_size_x=dx,
    block_size_y=dy,
)

mk = MeshKernel(projection=ProjectionType.SPHERICAL)
mk.mesh2d_make_rectangular_mesh(makeGridParameters)
mesh2d_not_refined = mk.mesh2d_get()
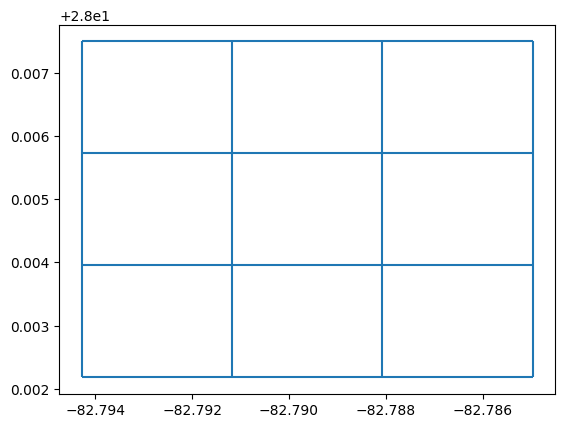
fig, ax = plt.subplots()
mesh2d_not_refined.plot_edges(ax)
samples = GeometryList(
    x_coordinates=x_coordinates, y_coordinates=y_coordinates, values=values
)
interpolation_parameters = InterpolationParameters()
interpolation_parameters.interpolation_type = InterpolationType.AVERAGING

property_id = mk.mkernel_set_property(interpolation_parameters, samples)

x_coordinates_pol = np.empty(0, dtype=np.double)
y_coordinates_pol = np.empty(0, dtype=np.double)
polygons = GeometryList(
    x_coordinates=x_coordinates_pol, y_coordinates=y_coordinates_pol
)

meshRefinementParameters = MeshRefinementParameters()
minimumRefinementDepth = 0.0
mk.mkernel_mesh2d_casulli_refinement_based_on_depths(
    polygons, property_id, meshRefinementParameters, minimumRefinementDepth
)
mesh2d_refined = mk.mesh2d_get()
fig, ax = plt.subplots()
mesh2d_refined.plot_edges(ax)